Arduino library for heart rate monitoring with pulse oximeter
One of the parameters monitored in my sleep management project
It's the pulse. to measure it I developed a device based on the behavior of hemoglobin and oxyhemoglobin against different wavelengths of light. Basically it is about measuring how much light of a certain type is able to pass through or be reflected in a well-irrigated area of the body. The frequency with which a complete cycle of this phenomenon occurs allows measuring the pulse.In the design and testing phase of the pulse measuring device I developed some small programs to help me verify that the assembly was correct. Firstly I wrote the code below, which took the measured values from time to time (at least every and at most each ) when they varied a minimum between one and the previous one (the value that corresponds to ) and the monitored from a computer with a Python application to be able to analyze them later.
|
1
2
3
4
5
6
7
8
9
10
11
12
13
14
15
16
17
18
19
20
21
22
23
24
25
26
27
28
29
30
|
#define PIN_OXIMETRO 0 // Pin analógico 0
#define MEDIDA_MINIMA 10 // Cambio menor monitorizado
#define TIEMPO_MAXIMO_MEDIDA 200 // Cambio menor entre medidas (determina la resolución vertical)
#define TIEMPO_MINIMO_MEDIDA 100 // Milisegundos entre medidas (determina la resolución horizontal)
int lectura_anterior_oximetro=0;
int lectura_oximetro;
unsigned long cronometro_minimo=0;
unsigned long cronometro_maximo=0;
void setup()
{
Serial.begin(9600);
//pinMode(PIN_OXIMETRO,INPUT); // Ya es entrada por defecto
}
void loop()
{
if(millis()>cronometro_minimo)
{
lectura_oximetro=analogRead(PIN_OXIMETRO);
if(abs(lectura_oximetro–lectura_anterior_oximetro)>MEDIDA_MINIMA||millis()>cronometro_maximo)
{
cronometro_minimo=millis()+TIEMPO_MINIMO_MEDIDA;
cronometro_maximo=millis()+TIEMPO_MAXIMO_MEDIDA;
lectura_anterior_oximetro=lectura_oximetro;
Serial.println(String(millis(),DEC)+“,”+String(lectura_oximetro,DEC));
}
}
}
|
Once the values were adjusted (starting with very dense measurements) I got a collection of values from the pulse oximeter over time that I could graph using a spreadsheet, LibreOffice Calc de LibreOffice, specific.

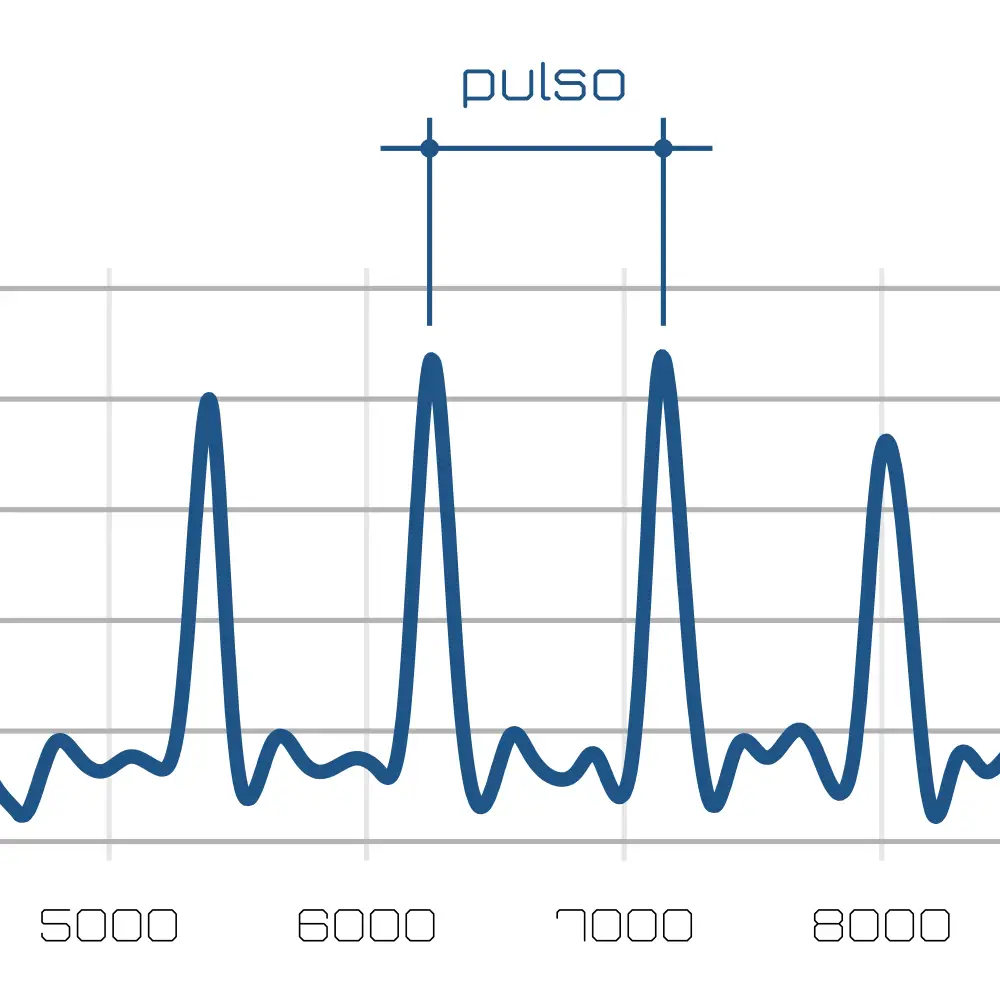
With the data collected, as represented in the image above, the next operation was to determine if the density of values allowed us to calculate in a reliable but "economical" way (not sampling more than the necessary data) the value of the pulse; As can be seen in the graph below, the measures taken seemed to serve to obtain the results that are reasonable to expect.
.

Next, with the information from the data sampling, it was necessary to develop an algorithm that would measure the pulse rate. Sticking to the graph that, for simplicity, it is assumed that it represents a layout similar to the QRS complex, the simplest thing seems to be to measure the times between the most prominent parts, with higher values (which corresponds to the qRs zone of depolarization of the ventricles), discarding the flatter and "noisier" zone, which is therefore more difficult to measure. The solution adopted, which corresponds to the test code below, works according to the following procedure:
-
Detect the area that is being measured in each case to only attend to the value peaks qRs and throw away the valley. To do this, values higher than a certain constant could be measured, but there is a risk that an individual and/or circumstances could, although proportionally, raise or lower the values. To avoid this, a value in the area is considered greater than the one that exceeds the average value by a certain coefficient. In this way, the measurement is sensitively self-calibrated and could be adjusted even further by fine-tuning the coefficient, which in my case I have achieved experimentally during the tests.
Choose the values of the descending zone for the measurement (Rs) of the peak qRs, as close as possible to the maximum of the curve. To know that the ascending zone is being abandoned, it is enough to verify that a new value is less than the previous one and verify that the searched value has not yet been found since, in general, there are several values in the descending zone of qRs depending on the sampling density. To time the pulse, the value of the instant at which the point was found is stored (the milliseconds returned by millis ()) and compares it with the next one.
To ensure that the value measured is the largest in the descending zone of the highest curve, a variable is used boolean ( in this example and in the library) that is activated when entering the ascending zone of the major curve and deactivated once the first descending value is found, which is the timed one.
As it is usual to represent the duration of the pulse as beats per minute (ppm), the value of time between pulses obtained is corrected by calculating by dividing the total time of the representation (one minute, 60000 milliseconds) by the interval obtained by subtracting the current milliseconds ( of the current value) among those previously timed.
To avoid false measurements (such as the device measuring in a vacuum, for example), it is verified that the result is between maximum and minimum values before taking it for granted. Although it is considered as an average that a normal value for a healthy adult at rest is between 60 and 100 ppm, there are admissible values below, it is easy to find 40 ppm in an athlete at rest, up to 200 ppm during intense exercise and more. of 100 ppm in sedentary adults in states of excitement, precisely an interesting factor for the sleep management project which leads me to develop this pulse measuring device. For this reason, it is advisable to relax these values a lot so that the extremes are not lost, which could precisely show relevant aspects.
The new average value is calculated by decreasing the relevance of the current average based on the number of values sampled and the last value is added, also weighted with a coefficient that reduces it further the more values that have been measured so far.
|
1
2
3
4
5
6
7
8
9
10
11
12
13
14
15
16
17
18
19
20
21
22
23
24
25
26
27
28
29
30
31
32
33
34
35
36
37
38
39
40
41
42
43
44
45
46
47
48
49
50
51
52
53
54
|
#define PIN_OXIMETRO 0 // Pin analógico 0
#define TIEMPO_MINIMO_MEDIDA 20 // Milisegundos entre medidas (determina la resolución horizontal)
#define COEFICIENTE_PULSO 1.25 // Coeficiente que determina la zona de valores en la que medir el pulso
#define PULSO_MENOR 30 // Ignorar valores menores (Es infrecuente un pulso más lento aún en reposo)
#define PULSO_MAYOR 180 // Ignorar valores mayores (Es infrecuente un pulso mayor en reposo)
#define MINUTO 60000.0 // Milisegundos en un minuto
float velocidad_pulso;
float lectura_media_oximetro=511.5;
unsigned long valores_contados=0;
int lectura_anterior_oximetro=0;
int lectura_oximetro;
boolean medir_pulso=false;
unsigned long cronometro_pulso=0;
unsigned long cronometro_oximetro=0;
void setup()
{
Serial.begin(9600);
//pinMode(PIN_OXIMETRO,INPUT); // Ya es entrada por defecto
}
void loop()
{
if(millis()>cronometro_oximetro)
{
cronometro_oximetro=millis()+TIEMPO_MINIMO_MEDIDA;
lectura_oximetro=analogRead(PIN_OXIMETRO);
valores_contados++;
lectura_media_oximetro=lectura_media_oximetro*(float(valores_contados–1)/valores_contados);
lectura_media_oximetro+=lectura_oximetro*(1.0/valores_contados);
if(lectura_oximetro>lectura_media_oximetro*COEFICIENTE_PULSO)
{
if(lectura_anterior_oximetro<lectura_oximetro)
{
medir_pulso=true;
}
else
{
if(medir_pulso)
{
velocidad_pulso=MINUTO/float(millis()–cronometro_pulso);
medir_pulso=false;
if(velocidad_pulso>PULSO_MENOR&&velocidad_pulso<PULSO_MAYOR)
{
Serial.println(“Pulso “+String(velocidad_pulso,DEC));
}
cronometro_pulso=millis();
}
}
}
lectura_anterior_oximetro=lectura_oximetro;
}
}
|
Finally, using the algorithm described before, I developed the library to calculate the pulse by detecting the presence of the hemoglobin or the oxyhemoglobin (depending on the wavelength of light used) from the code below.
The library expects the sampling function to be called periodically to calculate the pulse, which can be consulted with the function or with the function the average pulse. In addition to being a limited resource, I ruled out using interruptions because I did not need immediate values but rather sustained ones over time to monitor the pulse in my sleep management project
. In any case, from the tests I have done, it does not seem to be necessary; either by the device or by the behavior of the pulse, sampling at a certain frequency offers enough information and not much more (relevant) is obtained by increasing it, nor is it possible to decrease it much without losing relevant data for the calculation; in early versions of the code to monitor the reading of the pulse oximeter I discovered that it was not necessary to stick to a maximum measurement time since, if the variations of successive values were correctly considered, it was very close to the minimum.
|
1
2
3
4
5
6
7
8
9
10
11
12
13
14
15
16
17
18
19
20
21
22
23
24
25
26
27
28
29
30
31
32
33
34
35
36
|
//pulso.h
#if defined(ARDUINO) && ARDUINO>=100
#include “Arduino.h”
#else
#include “WProgram.h”
#endif
#define PULSO_MINIMO 5 // Pulso mínimo. Un pulso menor se considera un error.
#define PULSO_MAXIMO 200 // Pulso máximo. Un pulso mayor se considera un error.
#define COEFICIENTE_PULSO 1.25 // Coeficiente que multiplica el pulso medio para determinar si el valor medido está en la zona que se cronometra. Puede usarse para calibra el dispositivo
#define OXIMETRIA_MEDIA 511.5 // Medida media inicial del pulso (1023/2) Puede usarse para calibrar el dispositivo
#define PULSO_MEDIO 80.0 // Pulso medio de un adulto en reposo (sólo para referencia)
class Pulso
{
private:
byte pin_oximetro; // Pin analógico al que se conecta el sensor de pulso
int lectura_oximetro; // Último valor medido en el sensor de pulso
int lectura_anterior_oximetro; // Penúltimo valor medido en el sensor de pulso para compararlo con el último y establecer la zona de valores en la que se encuentra
unsigned long numero_lecturas_oximetro; // Número de medidas del oxímetro tomadas. Usado para calcular la media
unsigned long numero_lecturas_pulso; // Número de medidas de pulso tomadas. Usado para calcular la media
float lectura_media_oximetro; // Medida media del sensor de pulso. Usado para saber si un valor se encuentra en la zona de medida (que se cronometra) del pulso
boolean medicion_de_pulso_activa; // Verdadero si se ha entrado de la zona del pulso (para no confundir si aún se encuentra en una zona ya medida)
float velocidad_pulso; // Último valor de pulso calculado
float ultima_velocidad_pulso; // Último valor de pulso correcto
float velocidad_media_pulso; // Media de los pulsos calculados durante la última sesión (creación del objeto Pulso)
unsigned long cronometro_pulso; // Tiempo entre medidas de pulso consecutivas
protected:
public:
Pulso(byte pin_oximetro_solicitado);
~Pulso();
void monitorizar_pulso(); // Se llama periódicamente (entre 10 y 50 ms) para calcular el pulso
byte ultimo_pulso(); // Devuelve el último valor correcto de pulso muestreado
byte pulso_medio(); // Devuelve el pulso medio de la sesión
};
|
|
1
2
3
4
5
6
7
8
9
10
11
12
13
14
15
16
17
18
19
20
21
22
23
24
25
26
27
28
29
30
31
32
33
34
35
36
37
38
39
40
41
42
43
44
45
46
47
48
49
50
51
52
53
54
55
56
57
58
59
60
61
62
63
|
//pulso.cpp
#include “pulso.h”
Pulso::Pulso(byte pin_oximetro_solicitado)
{
pin_oximetro=pin_oximetro_solicitado;
//pinMode(pin_oximetro,INPUT); // Ya es entrada por defecto
numero_lecturas_oximetro=0;
numero_lecturas_pulso=0;
lectura_media_oximetro=OXIMETRIA_MEDIA;
velocidad_media_pulso=PULSO_MEDIO;
medicion_de_pulso_activa=false;
lectura_anterior_oximetro=0;
ultima_velocidad_pulso=0; // Para indicar que es un valor incorrecto por el momento
cronometro_pulso=0;
}
Pulso::~Pulso()
{
}
byte Pulso::ultimo_pulso()
{
return round(ultima_velocidad_pulso);
}
byte Pulso::pulso_medio()
{
return round(velocidad_media_pulso);
}
void Pulso::monitorizar_pulso()
{
lectura_oximetro=analogRead(pin_oximetro);
numero_lecturas_oximetro++;
lectura_media_oximetro=lectura_media_oximetro*(float(numero_lecturas_oximetro–1)/numero_lecturas_oximetro); // Cambiar la representatividad de la parte actual de la media de pulso
lectura_media_oximetro+=lectura_oximetro*(1.0/numero_lecturas_oximetro); // Añadir la nueva lectura a la media
if(lectura_oximetro>lectura_media_oximetro*COEFICIENTE_PULSO)
{
if(lectura_anterior_oximetro<lectura_oximetro) // Medida de valores creciente
{
medicion_de_pulso_activa=true;
}
else
{
if(medicion_de_pulso_activa)
{
velocidad_pulso=60000.0/float(millis()–cronometro_pulso); // Cálculo de las pulsaciones por minuto (representación habitual del pulso)
medicion_de_pulso_activa=false; // Ya se ha medido el pulso, no medir hasta entrar en una nueva zona ascendente
if(velocidad_pulso>PULSO_MINIMO&&velocidad_pulso<PULSO_MAXIMO)
{
numero_lecturas_pulso++;
ultima_velocidad_pulso=velocidad_pulso;
velocidad_media_pulso=velocidad_media_pulso*(float(numero_lecturas_pulso–1)/numero_lecturas_pulso); // Calcular la representatividad de la media actual en la nueva media
velocidad_media_pulso+=velocidad_pulso*(1.0/numero_lecturas_pulso); // Añadir la nueva lectura a la media
}
cronometro_pulso=millis();
}
}
}
lectura_anterior_oximetro=lectura_oximetro;
}
|
The following example program shows how to use the previous library to measure the pulse with pulse oximeter. In addition to instantiating the class monitoring of the level of oxyhemoglobin/hemoglobin and with a smaller periodicity the value of the pulse calculated and average.
To ensure that the measurements are relevant, a wait is programmed before displaying any value. As the value may be incorrect (for example if the user removes the device), values are only shown if they are within the range of those considered valid.
|
1
2
3
4
5
6
7
8
9
10
11
12
13
14
15
16
17
18
19
20
21
22
23
24
25
26
27
28
29
30
31
32
33
34
35
36
37
38
39
40
|
#define PIN_PULSOMETRO 0
#define TIEMPO_MONITORIZACION_PULSO 20
#define TIEMPO_PRESENTACION_PULSO 5000
#include “pulso.h”
Pulso pulso(PIN_PULSOMETRO);
unsigned long cronometro_monitorizacion_pulso;
unsigned long cronometro_presentacion_pulso;
byte velocidad_pulso;
byte velocidad_media_pulso;
void setup()
{
Serial.begin(9600);
cronometro_monitorizacion_pulso=0;
cronometro_presentacion_pulso=TIEMPO_PRESENTACION_PULSO*2;
}
void loop()
{
if(millis()>cronometro_monitorizacion_pulso)
{
cronometro_monitorizacion_pulso=millis()+TIEMPO_MONITORIZACION_PULSO;
pulso.monitorizar_pulso();
}
if(millis()>cronometro_presentacion_pulso)
{
cronometro_presentacion_pulso=millis()+TIEMPO_PRESENTACION_PULSO;
velocidad_pulso=pulso.ultimo_pulso();
velocidad_media_pulso=pulso.pulso_medio();
if(velocidad_pulso)
{
Serial.print(“Pulso “);
Serial.print(velocidad_pulso,DEC);
Serial.print(” | Pulso medio “);
Serial.println(velocidad_media_pulso,DEC);
}
}
}
|


Post Comment