Status graphs of sensors connected to the Internet of Things IoT
One of the advantages of connecting a sensor network to the Internet of Things is being able to analyze the data obtained. By graphically representing this information, a person (as opposed to a program) can more intuitively understand the meaning of the monitored quantities, for example, by comparing them with each other or following their development over time.
This article begins a series, made up of four parts, that explains a simple proposal for graphical representation of data obtained by sensors connected to the IoT. With the same philosophy as in other articles, the suggested method is perfectly functional although the main objective is didactic. As the technical profile of the public to which the blog polaridad.es, and this text is about electronics and not web development, each of the sections serves as an introduction to the languages or technology used: HTML, CSS, SVG y JavaScript.


The articles in the previous series on how to store data obtained by devices connected to the Internet of Things (IoT) They ended by explaining how to access the information stored in the databases. In the examples of the series, to make the process easier, a web server was used as an intermediary that was responsible for receiving the data through POST requests of the HTTP protocol, storing it in a database and displaying it on a web page.


Although the main drawback of this system is performance (which could be alleviated with alternatives such as Node.js and MongoDB, which will be explained in future articles), in exchange it provides two great advantages: its implementation is very simple (including the availability of services public) and can display the data in a browser, that is, it does not need specific applications (such as an app for a mobile device) to present the stored information that would represent the historical status of devices connected to the Internet of Things.
Exploiting the advantage of being able to easily present on a web page the information that has been stored with this system about the status of devices connected to IoT, this article explains how to graphically display this information using the format SVG from JavaScript to dynamically generate a web page in HTML.
There are many bookstores JavaScript with which to solve the graphical presentation of data. These articles do not intend to develop another one; The purpose of this text is to understand the process and be able to develop your own implementations; a didactic objective as well as a productive one. If you are interested in using a product rather than developing it yourself, I recommend that you take a look at some of the excellent libraries for generating graphics with JavaScript with free licenses like Charts.js, Highcharts, Google Chart Tools, Epoch, Raphael, Graphic (based on Raphael), dc.js, Chartist.js, D3. js (my recomendation), C3.js (based on D3. js), NVD3 (reusable graphics for D3. js) ...
HTML document structure with SVG graphics
In this article's proposal to graphically present sensor data, the web page on which it is displayed is made up of:
- the document that serves as a container is written in HTML,
- the appearance of the page is defined with code CSS,
- the drawing of the graph is done using the language SVG y
- Reading data from the server and displaying graphs is programmed in JavaScript
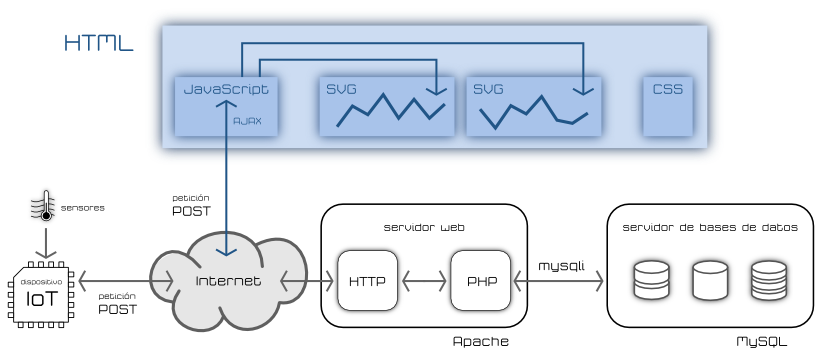
All elements, especially the code HTML of the page, can be generated on the server with PHP as explained in the article on the PHP programming language from the series about data storage from devices connected to the Internet of Things.
The code CSS y JavaScript can be loaded (imported) in code HTML instead of being written directly as part of the document HTML. This has the advantage of being able to reuse the same documents on several pages and being able to edit them more comfortably; but perhaps the inconvenience of taking a little longer to load depending on whether you can use the code contained in the cache (loaded in previous use) or even a CDN. In the production phase it is trivial to integrate all the code from PHP, generating a single document in HTML with all the information if you choose this alternative. Throughout this series of articles, for clarity, it is considered that we are working with separate documents.
For the purposes that interest us, to use it as a graphics container, and very roughly, the content of the first level of the structure of a document HTML would:
|
1
2
3
4
5
6
7
|
<!DOCTYPE html>
<html lang=“es”> <!– El código del documento HTML está escrito en español –>
<head>
</head>
<body onload=“funcion();”>
</body>
</html>
|
The first line serves to indicate to the web browser that the document it is reading is written in HTML, specifically in version 5 (known as HTML5). Previous versions of HTML, based on sgml (Standard Generalized Markup Language), included a document type definition (DTD) in which the type of rules used in the language to describe the document was declared.
The second and last lines contain the code HTML among the directives <html> y </html> which function as opening and closing respectively. The directives HTML They enclose the name and attributes between the signs "less than" and "greater than" forming a kind of "acute parenthesis" signs. The elements HTML that enclose content have a closing directive that includes the slash in front of the name as in </html>.
The properties or attributes of elements are separated by spaces from the name and from each other and are expressed as plain text or, more frequently, as text (the name of the property) followed by an equal sign and a value enclosed in quotes. In the case of the code opening directive HTML property has been used lang with the value es, lang="es" to indicate that the text of the document HTML uses the Spanish language.
A comment has been included after the opening directive of the HTML code. The comments in HTML They can occupy several lines and use the code as an opening sign <!-- and as a closing -->
The code HTML It is made up of two blocks: the header <head> and the body <body>. The first aims to inform about the document itself, including information about it (meta-information) and the second is to support the content of the document.
In the directive <body> an event has been included onload with which to automatically execute a function JavaScript once the content has been loaded. This resource allows you to start the execution of the code that will define the graphic objects and update them as information is loaded from the server about the state of the sensors that represent these graphics.
Of all the metainformation that can be included within the header of the document HTML, we are especially interested in knowing the one described by the following directives:
-
<title>which serves to give a title to the document. It will normally appear in the browser window or on the corresponding tab and will help us identify the graphics it contains. -
<charset>declares the character set used to encode the document. It is especially important for "special" signs such as eñes or accents. -
<link>allows establishing a relationship between the document HTML current and other external ones. It will help us load the style sheet in format CSS with the appearance of the document. -
<script>contains a script with executable code. Using this directive we will load the functions JavaScript with which to generate or modify graphics SVG.
|
1
2
3
4
5
6
7
8
9
10
11
|
<!DOCTYPE html>
<html lang=“es”> <!– El código del documento HTML está escrito en español… –>
<head>
<meta charset=“utf-8”> <!– …y codificado en el juego de caracteres UTF-8 –>
<title>Gáfico SVG de sensores conectados a la IoT</title>
<link href=“https://polaridad.es/grafica-sensor-internet-de-las-cosas-iot/aspecto.css” type=“text/css” rel=“stylesheet” media=“all”>
<script src=“graficos.js” type=“text/javascript”></script>
</head>
<body onload=“funcion();”>
</body>
</html>
|
As can be seen in the example of HTML above, the name (and path, if applicable) of the document with the style CSS is indicated with the attribute href, while in the case of the code JavaScript it is used src. Both share ownership type with the value text/css y text/javascript respectively.
With respect to the content of the document, the part that corresponds to the element <body>, HTML5 It allows you to create specific structures for the most frequent components on a web page such as a footer, a side section or a navigation bar, but what interests us is to use the document as a graphics container. SVG are the elements <div> that function as independent blocks that allow defining a hierarchical structure by nesting some <div> within others.
|
1
2
3
4
5
6
7
8
9
10
11
12
13
14
15
16
17
|
<!DOCTYPE html>
<html lang=“es”> <!– El código del documento HTML está escrito en español… –>
<head>
<meta charset=“utf-8”> <!– …y codificado en el juego de caracteres UTF-8 –>
<title>Gáfico SVG de sensores conectados a la IoT</title>
<link href=“https://polaridad.es/grafica-sensor-internet-de-las-cosas-iot/aspecto.css” type=“text/css” rel=“stylesheet” media=“all”>
<script src=“graficos.js” type=“text/javascript”></script>
</head>
<body onload=“funcion();”>
<div id=“padre” class=“aspecto_de_padre”>
<div id=“primer_hijo” class=“aspecto_de_hijo”>
</div>
<div id=“segundo_hijo” class=“aspecto_de_hijo”>
</div>
</div>
</body>
</html>
|
In the previous example an element is used <div> which contains two others. This example introduces two very important properties for the use we want to make of the code. HTML: id which is used to assign a unique identifier to an element HTML (a <div>, in this case) and class with which it is assigned a category that we will use to establish the appearance. The category, the class, does not have to be unique, in fact, much of its effectiveness lies in several elements sharing the same aspect.
The element (or tag) <p> serves to define a paragraph that will normally contain text (although in HTML there is no limitation in this regard). To make groupings within a paragraph (or a <div>, there are also no limitations) the tag is used <span>. With this element it is possible, for example, to include text within a paragraph to give it a different appearance such as underlined or bold.
The definition of the graphic characteristics and in general, the behavior that is associated with an element HTML Attributing a class is done in the code CSS; in the case of the previous example in the document aspecto.css.
To optimize the assignment of characteristics CSS it is possible that the same element HTML belongs to several classes and thus has the appearance or behavior defined by them. To make this assignment, write the names of the different classes, separating them by commas to the right of the property. class
|
9
10
11
12
13
14
15
16
|
<body onload=“funcion();”>
<div id=“padre” class=“aspecto_de_padre”>
<div id=“primer_hijo” class=“aspecto_de_hijo aspecto_raro tipografia_grande”>
</div>
<div id=“segundo_hijo” class=“aspecto_de_hijo”>
</div>
</div>
</body>
|
In the previous example, the element <div> which has been identified as primer_hijo Three classes have been assigned: aspecto_de_hijo, aspecto_raro y tipografia_grande, which are supposed to together define the appearance and behavior of the element. As explained in the following article on the Defining IoT Sensor Graphics Web Appearance with CSS, when using multiple classes, if any of the properties that define the aspect are defined in both, the last one referenced prevails.
As has been seen, the elements <div> They may contain other elements, including other <div>. A simpler case would be <div> that contained text. The look that defines style CSS would also affect the text contained in the element.
To optimize the assignment of characteristics CSS it is possible that the same element HTML belongs to several classes and thus has the appearance or behavior defined by them. To make this assignment, write the names of the different classes, separating them by commas to the right of the property. class
|
9
10
11
12
13
14
15
16
17
|
<body onload=“funcion();”>
<div id=“padre” class=“aspecto_de_padre”>
<div id=“primer_hijo” class=“aspecto_de_hijo aspecto_raro tipografia_grande”>
Este hijo de aspecto raro tiene la tipografía grande
</div>
<div id=“segundo_hijo” class=“aspecto_de_hijo”>
</div>
</div>
</body>
|
In the previous example, the three classes associated with the <div> primer_hijo They would define the appearance of the element and the text that contains it, for example, making the font in which it is written large (if the purpose indicated by its name in the last class is true)
Since version 5 (HTML5) it is possible to include the graphics code in format SVG within the code itself HTML as one more element. From the code point of view HTML, the content SVG it is an element <svg> which contains the different graphic elements (lines, circles, rectangles...
|
9
10
11
12
13
14
15
16
17
18
19
20
|
<body onload=“funcion();”>
<div id=“padre” class=“aspecto_de_padre”>
<div id=“primer_hijo” class=“aspecto_de_hijo aspecto_raro tipografia_grande”>
Este hijo de aspecto raro tiene la tipografía grande
</div>
<div id=“segundo_hijo” class=“aspecto_de_hijo”>
<svg id=“dibujo” class=“grafico” width=“100%” height=“100%” viewBox=“0 0 100 100” preserveAspectRatio=“none”>
<circle cx=“100” cy=“200” r=“50”>
</svg>
</div>
</div>
</body>
|
Although it has been said that the graphic characteristics of the elements HTML are defined in a style CSS and are associated with it through a class, it is also possible to assign some of them directly to the elements in two ways. On the one hand, you can use the property style and assign the different graphic characteristics of the object as its value. Logically, it is preferable to use the aforementioned technique of assigning the aspect to a class, but with this possibility you can add a small correction to an element (a very particular exception) without having to create a new class.
On the other hand, some elements HTML They allow you to use specific properties that define their appearance. In general, even if these properties exist, it is preferable to use classes but, unfortunately, not all elements offer this alternative, some expect a certain value to be indicated directly with those specific properties instead of referring to the associated class. One of the elements that have this type of behavior is precisely the code SVG, to which we must assign the percentage value of the width and height in the properties width y height, respectively, instead of the class.
As will be seen in more detail in the article that talks about SVG code, in order to use the simple method proposed, it is advisable to consider the dimensions of the graph as percentages. In the case of the total size of the object, by indicating 100% in the width and height value, it will be the container that sets the final dimensions (the <div> with id="dibujo", in the previous example)
In the case of the different components of the graph SVG (lines, circles, rectangles...), are included in an area that measures 100×100 (any unit) and expand in a rectangular shape without preserving the proportion. The properties viewBox y preserveAspectRatio of the element SVG They are responsible for establishing these values. in the first case with a rectangular view that goes from the coordinate point (0,0) to the coordinate point (100,100) and is expressed as "0 0 100 100" and in the second with the value none.
|
14
15
16
17
18
|
<div id=“segundo_hijo” class=“aspecto_de_hijo”>
<svg viewBox=“0 0 100 100” preserveAspectRatio=“none” width=“100%” height=“100%” id=“dibujo” class=“grafico”>
<circle cx=“100” cy=“200” r=“50”>
</svg>
</div>
|
With all of the above, you can now define a complete code that would serve as a graphics container. SVG generated or modified from JavaScript. The example below contains four graphics blocks that use the format HTML of the representation proposal that we are going to use.
|
1
2
3
4
5
6
7
8
9
10
11
12
13
14
15
16
17
18
19
20
21
22
23
24
25
26
27
28
29
30
31
32
33
34
35
36
37
38
39
40
41
42
43
44
45
46
47
48
49
50
51
|
<!DOCTYPE html>
<html lang=“es”> <!– Inicio del documento HTML con el idioma –>
<head> <!– Cabecera del documento HTML –>
<meta charset=“utf-8”> <!– Se utiliza el juego de caracteres UTF8 –>
<title>Temperaturas Nave E1</title> <!– Título del documento y seguramente de la ventana del navegador –>
<link rel=“stylesheet” href=“https://polaridad.es/grafica-sensor-internet-de-las-cosas-iot/estilo.css” type=“text/css” media=“all”> <!– Cargar el estilo “https://polaridad.es/grafica-sensor-internet-de-las-cosas-iot/estilo.css” guardado en la misma carpeta que este documento HTML –>
<script type=“text/javascript” src=“graficos.js”></script> <!– Cargar el código JavaScript del documento “graficos.js” guardado en la misma carpeta que este documento HTML –>
</head> <!– Final de la cabecera del documento HTML –>
<body onload=“iniciar_graficos();”> <!– Cuerpo del documento HTML. Al cargar el contenido llama a la función JavaScript iniciar_graficos() –>
<div id=“temperatura_frigorifico_a” class=“bloque_sensor”> <!– Bloque de datos del primer sensor –>
<div id=“titulo_temperatura_frigorifico_a” class=“bloque_titulo”>Temperatura frigorífico 01A</div> <!– Título del bloque de datos del sensor –>
<div id=“descripcion_temperatura_frigorifico_a” class=“bloque_descripcion”>Media de las sondas de temperatura del frigorífico 01A</div> <!– Descripción del bloque de datos del sensor –>
<div id=“fecha_temperatura_frigorifico_a” class=“bloque_fecha”>Cargando emperaturas</div> <!– Fecha de la última lectura de datos del sensor. Por ahora vacío, luego se rellenará con la aplicación JavaScript –>
<div id=“bloque_temperatura_frigorifico_a” class=“bloque_grafico”> <!– Bloque con el gráfico –>
<svg id=“grafico_temperatura_frigorifico_a” class=“grafico” width=“100%” height=“100%” viewBox=“0 0 100 100” preserveAspectRatio=“none”>
<path id=“linea_temperatura_frigorifico_a” d=“” style=“fill:none;stroke:#205587;stroke-width:4;stroke-opacity:1;” vector-effect=“non-scaling-stroke” />
</svg> <!– Gráfico de los datos –>
</div> <!– Final del bloque que contiene el gráfico –>
</div> <!– Final del bloque de datos del primer sensor –>
<div id=“temperatura_frigorifico_b” class=“bloque_sensor”>
<div id=“titulo_temperatura_frigorifico_b” class=“bloque_titulo”>Temperatura frigorífico 01B</div>
<div id=“descripcion_temperatura_frigorifico_b” class=“bloque_descripcion”>Media de las sondas de temperatura del frigorífico 01B</div>
<div id=“fecha_temperatura_frigorifico_b” class=“bloque_fecha”>Cargando emperaturas</div>
<div id=“bloque_grafico_temperatura_frigorifico_b” class=“bloque_grafico”>
<svg id=“grafico_temperatura_frigorifico_b” class=“grafico” width=“100%” height=“100%” viewBox=“0 0 100 100” preserveAspectRatio=“none”>
<path id=“linea_temperatura_frigorifico_b” d=“” style=“fill:none;stroke:#205587;stroke-width:4;stroke-opacity:1;” vector-effect=“non-scaling-stroke” />
</svg>
</div>
</div>
<div id=“temperatura_frigorifico_c” class=“bloque_sensor”>
<div id=“titulo_temperatura_frigorifico_c” class=“bloque_titulo”>Temperatura frigorífico 01C</div>
<div id=“descripcion_temperatura_frigorifico_c” class=“bloque_descripcion”>Media de las sondas de temperatura del frigorífico 01C</div>
<div id=“fecha_temperatura_frigorifico_c” class=“bloque_fecha”>Cargando emperaturas</div>
<div id=“bloque_grafico_frigorifico_c” class=“bloque_grafico”>
<svg id=“grafico_temperatura_frigorifico_c” class=“grafico” width=“100%” height=“100%” viewBox=“0 0 100 100” preserveAspectRatio=“none”>
<path id=“linea_temperatura_frigorifico_c” d=“” style=“fill:none;stroke:#205587;stroke-width:4;stroke-opacity:1;” vector-effect=“non-scaling-stroke” />
</svg>
</div>
</div>
<div id=“temperatura_frigorifico_d” class=“bloque_sensor”>
<div id=“titulo_temperatura_frigorifico_d” class=“bloque_titulo”>Temperatura frigorífico 01D</div>
<div id=“descripcion_temperatura_frigorifico_d” class=“bloque_descripcion”>Media de las sondas de temperatura del frigorífico 01D</div>
<div id=“fecha_temperatura_frigorifico_d” class=“bloque_fecha”>Cargando emperaturas</div>
<div id=“bloque_grafico_frigorifico_d” class=“bloque_grafico”>
<svg id=“grafico_temperatura_frigorifico_d” class=“grafico” width=“100%” height=“100%” viewBox=“0 0 100 100” preserveAspectRatio=“none”>
<path id=“linea_temperatura_frigorifico_d” d=“” style=“fill:none;stroke:#205587;stroke-width:4;stroke-opacity:1;” vector-effect=“non-scaling-stroke” />
</svg>
</div>
</div>
</body> <!– Final del cuerpo del documento HTML –>
</html> <!– Final del documento HTML –>
|
Below you can see what the previous code would look like, formatted with the style CSS corresponding, generating with JavaScript the graphics SVG with server readings of data stored by sensors connected to the IoT. Except that the data is not being loaded from the server but is being generated randomly in the client (your browser), the rest of the code is what will be used in the proposal defined in this series of articles.
The next article in this series explains how to define CSS styles to give appearance to the HTML code that acts as a container for the graphics SVG with which to represent the state of the sensors connected to the Internet of Things (IoT).


1 comment